Notes:
The list of settlements of administrative-territorial division (variable Territory) is presented in transliteration.
The English version of some transliterated Ukrainian words is presented below: Region = rehion / oblast
Territory Ukraina
Starting from April 2014, data on Ukraine are given excluding the temporarily occupied territory of the Autonomous Republic of Crimea, the city of Sevastopol and part of the temporarily occupied territories in the Donetsk and Luhansk oblasts.
Territory Lvivska oblast
In Lvivska oblast consumer price indices are being calculated starting from 1999.
Consumer price indices (corresponding month of the previous year=100%)
January
February
March
April
May
June
July
August
September
October
November
December
Ukraina
2023
126.0
124.9
121.3
117.9
115.3
112.8
111.3
108.6
107.1
105.3
105.1
105.1
2024
104.7
104.3
103.2
103.2
103.3
104.8
105.4
107.5
108.6
109.7
111.2
112.0
2025
112.9
113.4
114.6
115.1
115.9
114.3
..
..
..
..
..
..
Lvivska oblast
2023
125.6
124.9
122.2
119.0
115.8
112.9
111.2
108.2
107.4
105.6
105.6
105.0
2024
104.7
104.0
103.1
103.4
103.6
104.7
105.8
107.5
108.2
109.4
110.8
111.8
2025
112.4
112.6
114.0
114.8
115.6
114.2
..
..
..
..
..
..
Notes:
The list of settlements of administrative-territorial division (variable Territory) is presented in transliteration.
The English version of some transliterated Ukrainian words is presented below: Region = rehion / oblast
Territory Ukraina
Starting from April 2014, data on Ukraine are given excluding the temporarily occupied territory of the Autonomous Republic of Crimea, the city of Sevastopol and part of the temporarily occupied territories in the Donetsk and Luhansk oblasts.
- is an indicator that characterizes changes of the overall price level for goods and services purchased by the population for non-productive consumption over time. It reflects changes in the value of fixed consumption bundle of goods and services in the current period as compared to the base one.
PRICES RECORD
- is a method of collecting information on prices for goods (services) included in the consumption bundle by a sample of enterprises of trade, services, markets and seasonal fairs selling food products
CPI CALCULATIONS
- are based on the data on prices obtained through the record of prices (rates) on the consumer market and national accounts data of household expenditure for final consumption in the country as a whole at the level of sections, groups and classes according to the Classification of Individual Consumption by Purpose. For further distribution, detailed information on consumer cash expenditures of households is used based on household living conditions surveys.
CONSUMPTION BUNDLE OF REPRESENTATIVE GOODS (SERVICES)
- is the representative selection of the list of goods and services most often consumed by the population. It is determined centrally and is unique for all regions of the country.
REPRESENTATIVE PRODUCT (SERVICE)
- a set of products that are homogeneous in terms of their consumer properties and purpose and have the same tendency in prices change
PRICE
- is monetary values of unit of the goods or services
INDUSTRIAL PRODUCER PRICE INDEX
- is an indicator of changes over time within industrial production. It is compiled monthly using data on prices for the industrial products which are given according to the Nomenclature of Industrial Products (NIP) by sampling circle of enterprises. The prices are weighed by the volume of sold industrial products in monetary terms.


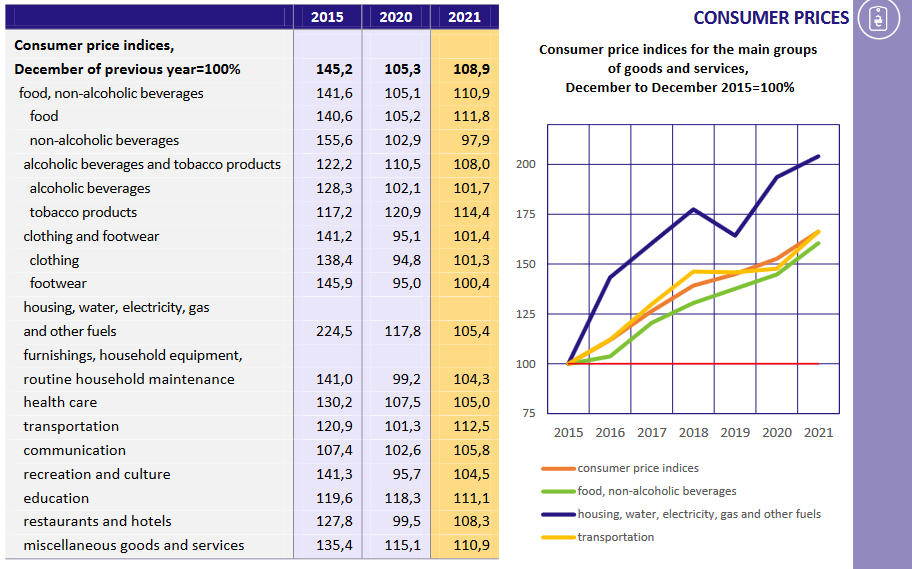
 Consumer price indices by main consumption groups (December of the previous year=100%) (Y)
 Consumer price indices (December of the previous year = 100%) (M)
 EMAIL: ve@lv.ukrstat.gov.ua
